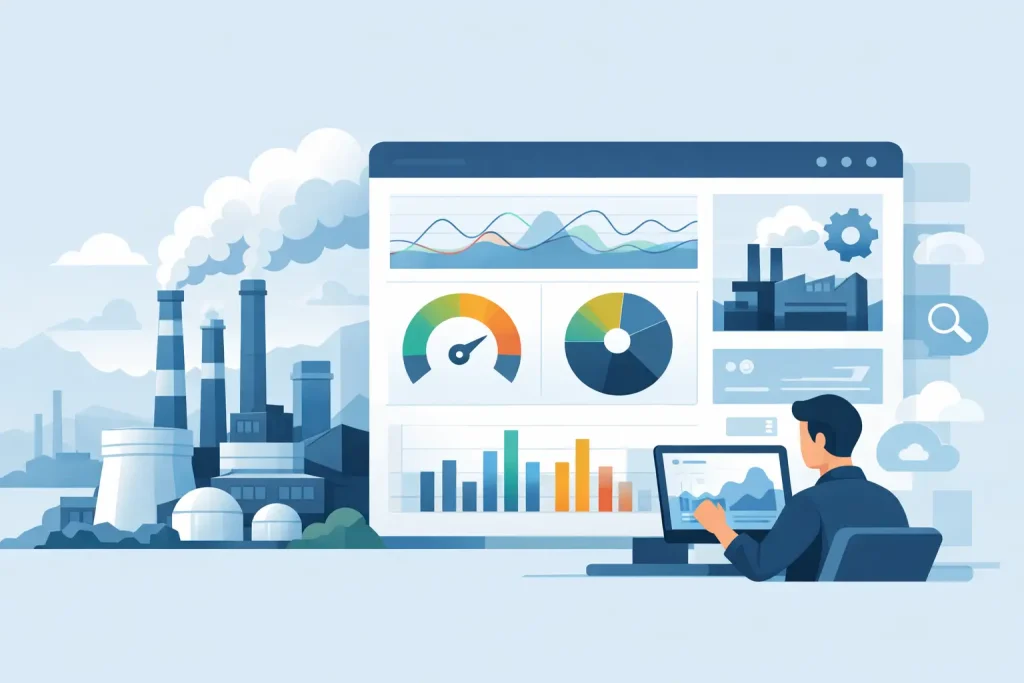
A dust collector can look operational from the factory floor while differential pressure climbs, fan performance falls, and emissions risk develops upstream of the stack. A factory emissions monitoring dashboard guide should therefore begin with a practical question: can the responsible person see, verify, and act on the conditions that affect emissions before a compliance issue becomes a shutdown, complaint, or failed test?
For plant managers, EHS leaders, and maintenance teams, the dashboard is not simply a screen for displaying sensor values. It is the operating layer between emission-control equipment, process conditions, maintenance activity, and defensible compliance records. When configured correctly, it makes performance visible across shifts and gives teams evidence for corrective action.
What an emissions monitoring dashboard should do
An effective dashboard consolidates the signals that show whether an air pollution control system is operating within its intended range. The right design depends on the process, permit conditions, applicable air-quality requirements, and the installed equipment. A metal casting facility with pulse-jet dust collectors needs a different view from a VOC process using activated carbon filtration or a regenerative thermal oxidizer.
At minimum, the dashboard should show current operating status, historical trends, alarms, and a clear record of operator response. It should connect process demand to control-system performance. A rise in production rate, for example, may explain increased airflow demand, but it does not justify an unexplained loss of capture velocity or a sustained high-pressure drop across a filter.
The dashboard should support four operational outcomes:
- Early detection of abnormal conditions before emissions increase or equipment is damaged.
- Faster diagnosis by showing related process, fan, filter, scrubber, or oxidizer data together.
- Documented response actions, including alarm acknowledgment, inspection, servicing, and return-to-normal verification.
- Reliable records for internal audits, regulator inquiries, stack sampling programs, and management review.
A dashboard cannot replace required continuous emissions monitoring systems, source testing, calibration procedures, or reference-method stack sampling where these are mandated. It can, however, provide the operational context that makes those formal compliance activities more effective.
Choose data points based on the control technology
Collecting every available signal is rarely useful. Too many poorly prioritized tags create alarm fatigue and hide the indicators that matter. Start with the emission source, the control device, the induced-draft or extraction system, and the final discharge point. Then identify the measurements that demonstrate each component is functioning as designed.
Dust collectors, cyclones, and local exhaust ventilation
For pulse-jet dust collectors, a practical dashboard normally includes differential pressure, compressed-air pressure, pulse-cleaning status, hopper level, fan run status, fan current or variable-frequency-drive speed, airflow or static pressure, and filter compartment alarms. Where suitable instruments are installed, stack opacity, particulate concentration, or airflow data can add useful confirmation.
Differential pressure needs interpretation rather than a single universal target. Low differential pressure may indicate torn filter media, leakage, poor dust loading, or faulty sensing. High differential pressure may indicate blinded bags, inadequate pulse cleaning, wet or sticky dust, a full hopper, or airflow restrictions. The dashboard should show the trend alongside cleaning cycles and fan operation so the maintenance team can identify the likely cause.
For local exhaust ventilation systems, capture performance is central. Monitoring fan status alone does not prove effective suction at the hood. Static pressure at critical branches, duct velocity, fan speed, damper position, and periodic field audit results should be reviewed together. This is particularly relevant where worker exposure to dust, fumes, oil mist, or welding contaminants is a concern.
Packed tower scrubbers and air strippers
Wet scrubber dashboards should focus on liquid-to-gas conditions and the equipment health that supports pollutant removal. Typical indicators include recirculation pump status, liquid flow, pH, oxidation-reduction potential where applicable, conductivity, tank level, pressure drop across the packed bed, make-up water flow, blowdown status, and fan operation.
A scrubber may remain mechanically active while chemical conditions drift outside the range required for absorption or neutralization. For that reason, pH and reagent usage should be trended with gas flow and pressure drop. A sudden pressure-drop change can indicate flooding, fouling, packing damage, or an instrument fault. Alarm logic should distinguish a brief process upset from a condition that requires operator intervention.
Thermal oxidizers and activated carbon systems
A regenerative thermal oxidizer dashboard should display combustion chamber temperature, bed temperature where relevant, combustion airflow, draft, burner status, fuel supply condition, valve sequencing, and bypass status. Destruction efficiency depends on more than reaching a temperature setpoint. Residence time, oxygen availability, loading, and stable flow conditions also matter.
For activated carbon filters, monitor pressure drop, airflow, inlet loading where measured, bed operating time, temperature, and any indicators of breakthrough. Carbon change-out schedules based only on calendar intervals can be wasteful or risky. Trending actual operating conditions supports a more defensible replacement plan, although laboratory testing or process-specific calculations may still be required to confirm remaining capacity.
Build alarms around decisions, not just thresholds
An alarm that does not tell someone what to check is noise. Each alarm should have an owner, a response expectation, an escalation path, and a documented verification step. The dashboard must separate advisory alerts from conditions requiring immediate action.
For example, a slightly rising dust collector differential pressure may generate an advisory for the maintenance planner. A high-high differential pressure combined with low airflow may require a production supervisor and maintenance technician to inspect the hopper, pulse-cleaning system, filters, and fan condition promptly. If an emissions-related parameter exceeds a permit limit or indicates control-device bypass, the event may require a formal environmental response.
Use time delays and persistence rules carefully. A five-second loss of signal during equipment startup should not create the same alarm as a fifteen-minute loss of recirculation flow during scrubber operation. At the same time, excessive delay can conceal a developing failure. Alarm settings should be tested during commissioning and reviewed after real operating experience.
Make trends useful for compliance and maintenance
The most valuable dashboard view is often not the live screen. It is the trend that reveals gradual deterioration over days, weeks, or production campaigns. Teams should be able to compare a current period with a known good baseline after testing and commissioning.
Trend charts should place related variables on the same time scale. For a dust collection system, compare differential pressure, fan speed, compressed-air pressure, production status, pulse frequency, and airflow. For a scrubber, compare gas flow, recirculation flow, pH, reagent addition, and pressure drop. This approach turns a data historian into an engineering tool rather than a passive archive.
Reporting should be scheduled around operational needs. Shift reports help supervisors identify unresolved alarms. Weekly reviews support maintenance planning. Monthly or quarterly reports can support EHS management review, internal auditing, permit reporting preparation, and discussions with senior leadership. The exact retention period and report format should follow applicable permits, corporate requirements, and local regulations.
Do not rely solely on dashboard screenshots as compliance evidence. Retain calibration records, instrument maintenance logs, operator entries, stack sampling reports, inspection findings, and corrective-action documentation. A clean trend chart is only credible when the measurement chain behind it is maintained.
Treat data quality as part of the control system
A dashboard is only as reliable as its sensors, communications, and operating procedures. Instruments can drift, impulse lines can plug, pressure taps can fill with dust, and a failed transmitter can show a believable but incorrect value. Data-quality alarms should identify frozen readings, out-of-range values, communication loss, and overdue calibration.
Critical signals need a defined maintenance plan. Specify who verifies them, how often they are inspected, what calibration standard applies, and how failed data are handled. Where a measurement is used to demonstrate permit compliance, the quality assurance requirements may be substantially stricter than for a maintenance-only indicator.
Cybersecurity also deserves attention. Remote monitoring provides valuable visibility for multi-site teams and service support, but access should be role-based and controlled. Separate viewing permissions from control permissions, maintain backups, and ensure that a network interruption does not compromise the safe operation of the emission-control equipment.
Commission the dashboard with the equipment
A dashboard should be included in the project scope from design through testing and commissioning, not added after the control system is already in operation. Confirm tag names, scaling, units, alarm limits, communication paths, and fail-safe behavior before handover. Then validate the display against actual field instruments and observed equipment behavior.
Operators need training that is specific to their equipment and compliance responsibilities. They should understand what normal operation looks like, which deviations require immediate escalation, and how to record corrective actions. Maintenance staff need access to diagnostic trends, while EHS personnel need reports that connect equipment performance to regulatory and audit obligations.
A properly engineered monitoring dashboard does not eliminate the need for inspections, field auditing, servicing, or stack sampling. It gives those activities a clearer purpose. When the data, alarms, and response process are aligned with the control technology, the facility gains more than visibility: it gains a practical basis for protecting uptime, worker air quality, and compliance confidence.